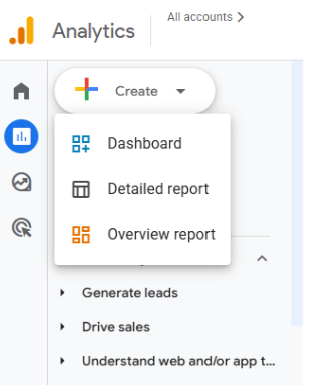
Google is currently rolling out a new ‘Dashboards’ feature across Google Analytics 4 (GA4) properties. Found in the ‘Create’ dropdown, at the top of the Reports section of GA4, this tool allows users to build custom, visual summaries using a simple drag-and-drop layout.
Currently, you have the option to add scorecards, tables, line graphs, bar charts, doughnuts, and funnels to a single page dashboard, giving you a quick visual, somewhat customisable snapshot of your site performance without leaving GA4 or needing to switch across to other reporting platforms such as Data Studio.
With this new built-in reporting arriving in GA4 you may be asking:
Do GA4 dashboards mean we no longer need Data Studio*?
*(previously Looker Studio, and now renamed back to Data Studio once again!)
To answer this question, let’s explore what these new GA4 dashboards can actually do and compare the two Google reporting tools side by side.
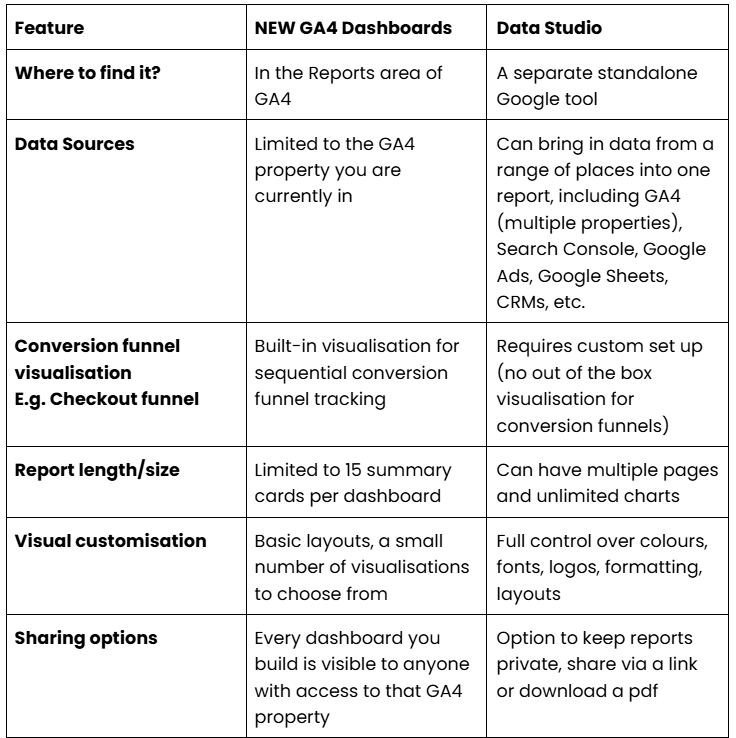
Key differences at a glance
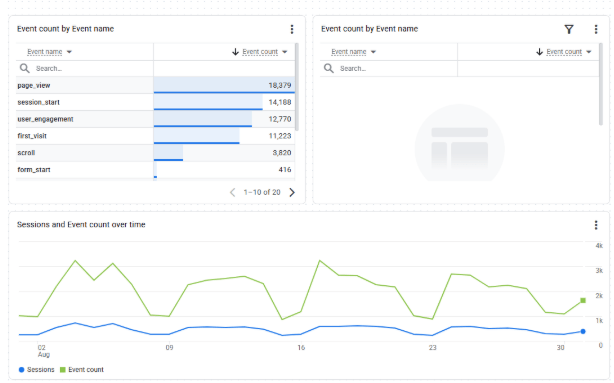
GA4 dashboard
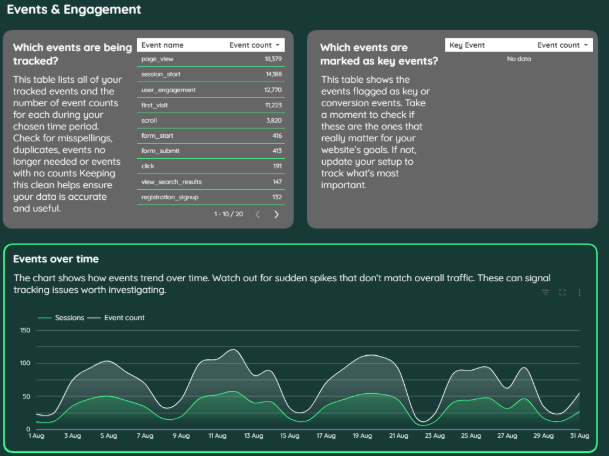
Data Studio dashboard
The pros and cons of GA4 dashboards
The two main advantages of the GA4 dashboards are convenience and ease of use. Having built-in reporting in GA4 reduces platform switching time, and out-of-the-box conversion funnel visualisations make it simple to track user drop offs (such as checkout steps) without needing to set up complex custom code.
However, GA4 dashboards have two significant drawbacks that limit their usefulness for strategic decision-making. Currently in GA4 dashboards, you can only view GA4 data (no ability to display data from other sources), and you are capped at 15 cards per dashboard, meaning that you cannot build comprehensive, multi-page reports.
These limitations reduce the overall value of the reports because they prevent you from being able to add critical context to the Google Analytics data.
When to use each reporting tool
Use GA4 dashboards when:
- You want to easily set up and analyse conversion funnels
- You want a set of quick, light, user-friendly overview dashboards to make regular, high-level performance checks
- You want to share simple, standardised overviews with team members who log into GA4 regularly
Use Data Studio when:
- You want visibility over multiple data sources when making strategy decisions
- You want to provide clients or leadership teams (who may not have access to GA4) with fully branded reports that provide context and analysis
- You want to be able to create multi-page, fully customisable reports with more complex charts and options for advanced user interaction
How Varn can help
Using a combination of both tools (for different purposes) gives you the ability to make quick internal checks inside GA4, but also to analyse more complex, multi-channel data for more in-depth strategic analysis. There is certainly a place for both, but for the time being GA4 dashboards won’t be taking the place of Data Studio when it comes to advanced, bespoke reporting.
If you would like to discuss setting up bespoke reporting, get in touch with our expert search and data team today. Get in touch we would love to hear from you.

Do you need help with data?
Get in touch with our expert data teamYou might also be interested in...
Data & Analytics 19.08.26
Data-informed decisions: Translating insights into strategic action
Read more
Article by:
Data & Analytics, Google Analytics, Reporting 17.04.26
Unlocking decision grade data: Why you need GA4 and BigQuery
Read more
Article by:
Data & Analytics 21.08.26
Empowering teams: Building long-term data confidence
Read more
Article by: